Is missing heritability actually missing? A population genetic perspective
Twin studies say IQ is 50–80% heritable, is that really the case?

Twin studies say IQ is 50–80% heritable. The best genomic methods say it’s 11-17%. Both numbers can’t be right, and the answer matters. This difference between twin and molecular estimates is referred to as the “missing heritability” problem, and the mystery is more than just a quaint academic dispute. Heritability is frequently invoked in metapolitical discourse by the right, from Charles Murray to the white-supremacist Pioneer Fund, to argue that high heritability justifies social hierarchy, racial inequality, and eugenics. The sky-high 80% heritability estimates superficially give credence to these odious beliefs. The desire is so great that a notorious case of scientific fraud, the Cyril Burt affair, centered on an effort to validate high heritabilities for IQ and social status (Tucker, 1994, 1997).
Through the 20th century, the genetics of complex traits was carried out primarily by twin studies. By comparing the similarity of identical and fraternal twins, researchers derived estimates of “heritability” (an estimate of how much variation in a trait is associated with genetic variation) for their traits of interest. These methods tended to result in heritability estimates of 50% or higher, with traits like intelligence often hitting as high as 80%.
In the genomics age, new methods using DNA sequencing data and genome-wide association studies (GWAS) were developed to estimate the effects of individual bits of DNA (single-nucleotide polymorphism; SNPs); combined analysis of those effects yielded heritability estimates. But gasp, this time heritability estimates were mostly around 20-30%. Even worse, it was discovered that many traits, especially social/behavioral ones, have their molecular estimates upwardly biased by the complex social processes that make humans such an awful study system for genetics. The newly developed molecular family-based methods removed most of these confounds to identify the direct effect of genetics, but yielded even smaller estimates; traits like education, income, or IQ now fell below 20%.
Explanations for “missing heritability” generally fall into two categories:
Twin studies are overestimating because they make untenable assumptions about the lack of environmental covariance and interaction, and the environmental similarity of the types of twins.
Molecular methods are underestimating because they are missing something: rare variants that are too low-frequency to be detected by commonly used genotyping arrays.
Figuring out which (or what combination) of these processes causes the “missing heritability” is still an open question. Luckily, population genetics gives us the tools to probe this puzzle by asking: “What would things have to look like for the rare variant explanation to work?” By the end, we will have a quantitative estimate of how much rare variants contribute to heritability, and decisively show that they cannot explain the missing heritability for IQ.
Let’s get down to business
All variants start off rare when they first arise as a mutation, but to stay rare requires that the action of natural selection against a variant is faster than mutation can reintroduce it. New mutations are continuously appearing in the genome at a certain rate, μ (traditionally set to ≈ 10⁻⁸). If they are harmful, then selection acts to purge them. An allele’s frequency, q, is determined by the balance between the mutation rate and the strength of selection.
Where s is the selection coefficient. This coefficient represents the fitness cost per copy of the variant, i.e. an s of 10⁻² (0.01) is a 1% reduction in fitness per copy (very strong selection) and an s of 10⁻⁵ (0.00001) is a 0.001% reduction in fitness (very weak selection).
Already, we’ve learned something important: for a variant to be rare (say, 0.1%-0.5%, the detection limit of genotyping arrays), it needs to be under quite strong selection. When people claim that rare variants explain missing heritability, they are really claiming that a large fraction of the genes involved in that trait are under strong purifying selection. This is a quantitative claim that can be tested.
What does the distribution of selection really look like?
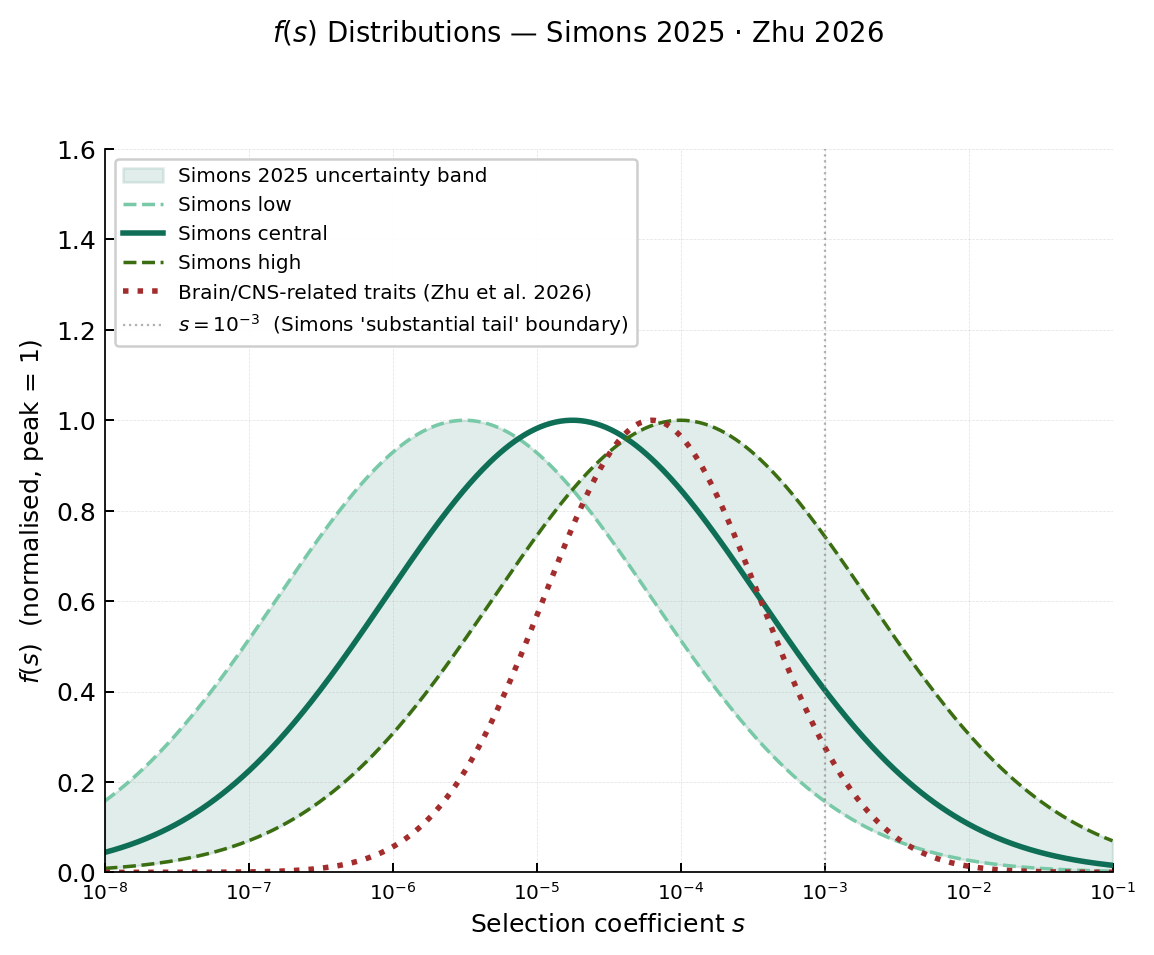
Simons et al. (2025) recently investigated the genetic architecture of complex traits, and specifically used GWAS results from 95 complex traits to infer the distribution of selection coefficients f(s). Unexpectedly, they found that the fitted distribution is remarkably consistent across all traits. The median strength of selection is
≈10⁻⁵ - 10⁻⁴, meaning most causal variants are under weak selection, not much stronger than genetic drift. However, the right tail extends above s = 10⁻³. A recent preprint by Zhu et al. (2026) focused specifically on the genetic architecture of brain and central nervous system (CNS) related traits. Their results showed that brain traits are indeed under somewhat stronger selection than non-brain traits, shifting to a median of s ≈ 10⁻⁴. But the higher selective constraint also meant that variants occupied a narrow range of selection coefficients. These provide solid empirical estimates, based on model fitting across hundreds of traits, and are our useful guides for what selection values are realistic for answering our question.
Are there enough rare variants to matter?
So variants tend to occupy either fairly weak selection, but with wide tails covering stronger selection coefficients, or they are under somewhat stronger selection, but over a narrower range. This doesn’t make the rare variant claim seem very likely, but are the tails of the distribution, or the rightward shift, enough to increase rare variant heritability?
At this point, the critical question for the rare variant explanation is whether there are enough strongly selected variants to outweigh the common ones. We can add together all their contribution but we first need to figure out how much a variant contributes to heritability. Luckily, the answer is surprisingly simple. The contribution is dependent on both its frequency, q, and the size of its effect on a trait, β :
Rare variants, it turns out, sit at a tradeoff. They occur at low frequency, so they have a low q. But because a large effect is what makes a variant deleterious enough for selection to move it to low frequency, they also have a large β. When selection is stronger than ≈ 1/2Nₑ, (≈ 3 × 10⁻⁵ for Nₑ = 15,000)), the low frequencies and large effects of rare variants perfectly trade off, and each variant contributes roughly the same amount to heritability, regardless of its frequency or effect size. This flattening of heritability contribution was a result formally derived by Simons et al. (2018).
Putting it all together
We now have a straightforward way to answer our original question.
If all rare variants contribute equally to heritability, we just need to find the fraction of variants under a given frequency, q*, for every class of variants sharing a selection coefficient, s.
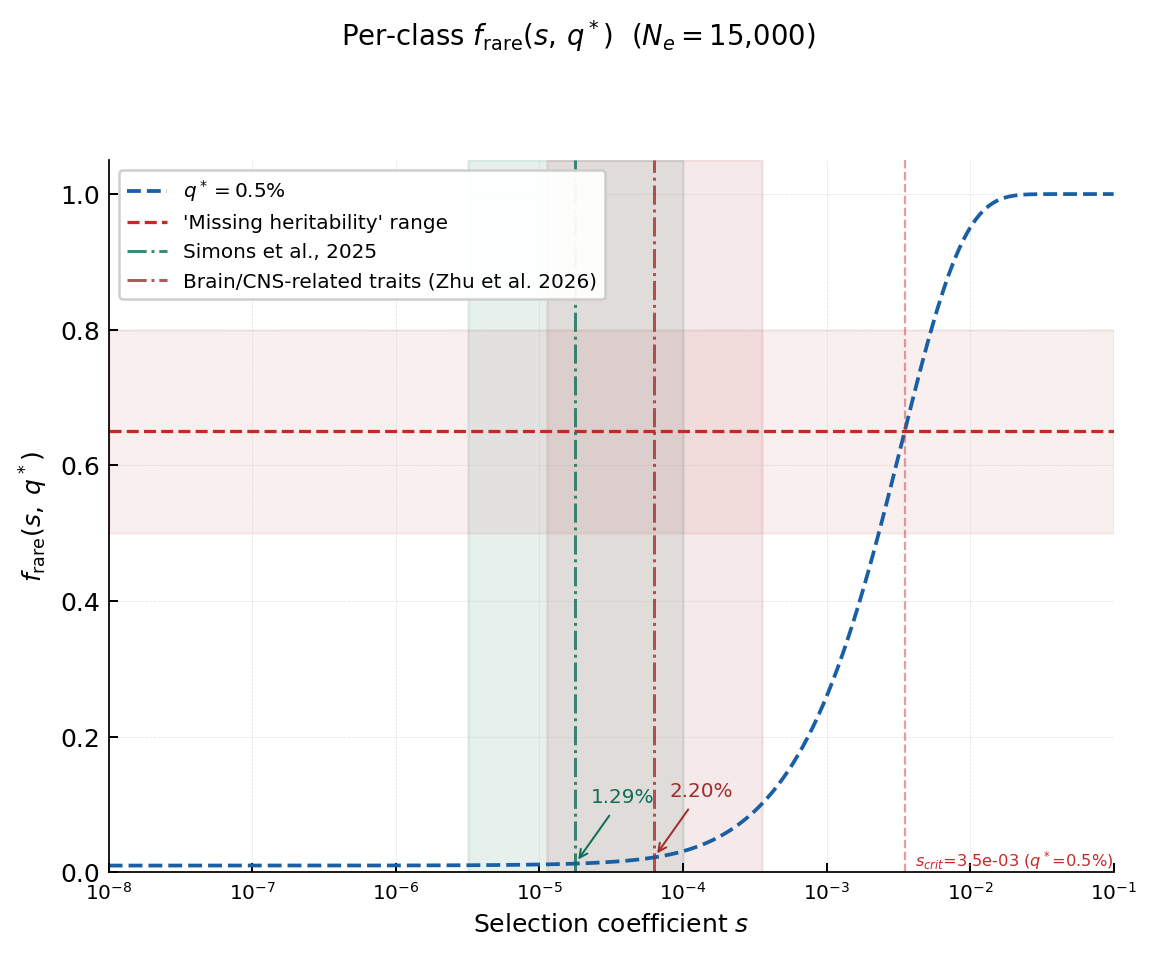
The above plot gives us the picture. For a variant at 0.5%, the limit of many genotyping arrays, and using Nₑ = 15,000 (the harmonic-mean effective population size relevant to the human lineage), at very weak selection like s = 10⁻⁵, f_rare is very low, ~1%. Not until very strong selection, s > 10⁻³, does the fraction of rare variants increase substantially. Notably, the selection coefficients needed to get that frequency of rare variants are orders of magnitude stronger than the median coefficients for Simons or brain-related traits. The case for rare variants seems to be getting weaker by the second.
We can get the full answer to the question by asking if these empirical f(s) from Simons et al. (2025) and Zhu et al. (2026) are sufficient to produce enough rare variant heritability to close the missing heritability gap. Integrating f_rare(s, q*) over all selection coefficient classes tells us how much heritability is captured by variants at or below a given frequency q*.
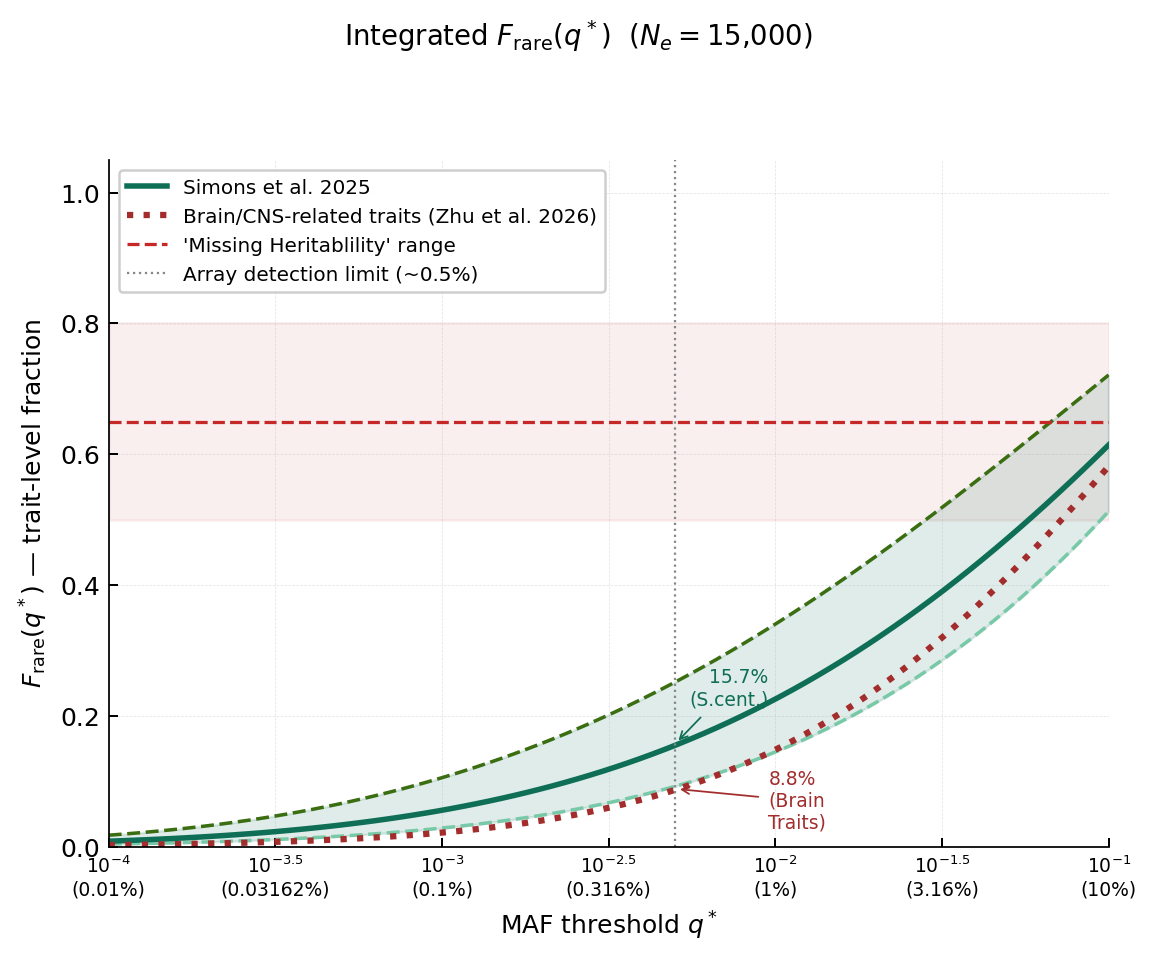
The model predicts that somewhere between 9% and 25% of total heritability sits in variants below 0.5%, and the brain-specific distribution sits even lower.
Thinking about the results in context
Let’s compare that to the missing heritability gap for IQ. It’s tremendous: Studies using genetic comparisons of family members, which provide the most robust correction for environmental confounding, estimated the direct genetic heritability of IQ to be ~11-17% (Gusev 2023; Tan et al. 2026). Meanwhile hereditarians claim that IQ is 50% or even 80% heritability by adulthood. That leaves a whopping 66-86% of remaining twin heritability that rare variants need to account for. Even the highest realistic selection scenario only gets to 25%, and brain-specific estimates would put it more at ~9%. Rare variants under purifying selection simply cannot come close to eliminating the heritability gap for IQ. The only way it would be possible is if it were under orders of magnitude stronger selection than all evidence would suggest. Other complex traits may still have their missing heritability explained by rare variants, provided the gap was small to begin with, but IQ is clearly a case of twin model inflation.
Our predictions are a strong theoretical result firmly against the rare variant explanation for traits like IQ, but it is still purely a theoretical model; an inference of what variation should look like under a specific set of assumptions. It would be nice to know how well our model predictions match real data. Two recent papers provide such a sanity check. Wainschtein et al. (2026) recently used whole-genome sequencing, capable of reaching the rare variants missed by genotyping arrays, precisely to see how much rare variant heritability there is across traits. They found that, on average, rare variants (< 1%) account for roughly 21% of the total heritability, eerily close to the model’s central estimate of 22.6%. The few exceptions, specifically IQ and Education, boast rare variant heritabilities of 25% and 42%. However, Wainschtein et al.’s (2026) results rely on population-level analyses of unrelated individuals. Unlike within-family methods, these estimates can be biased by indirect effects, complex gene-environment confounding that can be absorbed as genetic effects without proper controls. IQ and education are traits where indirect effects are known to bias methods like Wainschtein et al., (2026), explaining this apparent departure from our model. A follow-up by the same group, Wang et al. (2026), looked at even lower frequencies (< 0.01%), and found that ultra-rare variants capture between 0.0-3.4% of total heritability, while our model predicts 0.2-1.7%; Right in the ballpark again. Their conclusion, like ours, is that ultra-rare variants are unlikely to contribute to the missing heritability. Their results also emphasize how controlling for population structure and indirect effects is even harder when analyzing rare variants.
Conclusion
Our story has a satisfying close. Population genetic theory predicts that rare variants will contribute only a small amount to heritability, and the model predictions are solidly confirmed by empirical sequencing data. In all likelihood, at most ~25% of total trait heritability is actually missing from molecular heritability estimates from genotyping arrays. This is a nice, clean result. The best explanation for the “missing heritability” is that twin studies systematically overestimate heritability because they assume that genes and environment don’t interact or correlate, and that identical and fraternal twins experience similar environments. Family-based molecular estimates, which control for these confounds by design and leverage the random assignment of alleles during meiosis, are closer to the ground truth. Heritability of IQ, in the minimal sense that matters for any of the political claims made in its name, is probably somewhere in the range of 15–25%. When someone tells you that IQ is 80% heritable and molecular studies are unreliable because they miss rare variants, link them to this post, especially if they’re using it to justify scientific racism. They’re making an empirical claim, and they’re wrong
A more detailed derivation can be found here:
Disclosure: The derivation and code to produce the plots were developed with the aid of Claude Opus 4.6.
Citations
Simons, Y.B., Bullaughey, K., Hudson, R.R. & Sella, G. (2018). A population genetic interpretation of GWAS findings for human quantitative traits. PLOS Biology 16(3): e2002985.
Simons, Y.B., Mostafavi, H., Zhu, H., Smith, C.J., Pritchard, J.K. & Sella, G. (2025). Simple scaling laws control the genetic architectures of human complex traits. PLOS Biology 23(10): e3003402.
Zhu, H., Simons, Y.B., Spence, J.P., Sella, G. & Pritchard, J.K. (2026). Genetic architectures of brain-related traits are shaped by strong selective constraints. bioRxiv 2026.03.22.713538.
Tenesa, A. et al. (2007). Recent human effective population size estimated from linkage disequilibrium. Genome Research 17(4): 520–526.
Tucker, W. H. (1994). Fact and fiction in the discovery of Sir Cyril Burt's flaws. Journal of the History of the Behavioral Sciences, 30(4), 335-347.
Tucker, W. H. (1997). Re‐reconsidering Burt: Beyond a reasonable doubt. Journal of the History of the Behavioral Sciences, 33(2), 145-162.
Gusev (2024, Oct 13). What are we learning from the genes of siblings?. TheInfinitesimal
Wainschtein, P. et al. (2026). Estimation and mapping of the missing heritability of human phenotypes. Nature.
Wang, H., et al. (2026). Pitfalls in estimating and interpreting the contribution of ultra-rare genetic variants to the heritability of complex traits. medRxiv, 2026-04.
I would push back on your first couple of sentences, which imply that heritability of intelligence (or anything else) is a fixed property of a phenotype that we are trying to estimate as accurately as possible. It isn’t: it’s a ratio of genetic and phenotypic variances, and its value depends on the magnitude of both of them. The heritability of a trait in a population of clones is zero; in a genetically diverse population it is much higher. This variation doesn’t represent error around some true value, because there is no principled way to establish what the “true” values of genetic and environmental variability are. These problems are especially acute in human beings. In plants and animals, the scientist has experimental control over the variances, so heritability can be estimated with respect to some fixed set of variances and covariances. Human variation is uncontrolled and uncontrollable.
You say in the response to the LLM that you don’t mention epistasis, but I do think it is important here. Human heritability is estimated by relating genetic and phenotypic similarity— on the one end comparing MZ and DZ twins, on the other comparing the SNP-similarity of more or less “unrelated” people. One reason these two estimates don’t reach the same conclusion is that MZ twins instantiate genetic similarity in ways that no other pairs of people reproduce. This is not to say that twin heritability is the correct one, it just suggests that genetics makes twins similar in ways that they don’t make most people similar. Most people, of course, don’t have twins to predict from. This paper by Eftedal et al is interesting in that regard: https://www.pnas.org/doi/abs/10.1073/pnas.2419627122.
Thanks for putting this together! I tend to approach the missing heritability debate from only the empirical side since I don’t have a super strong background in population genetics theory, so this writeup was helpful. I think my one question was about the Simons et al results. If I understood the paper correctly, they assume a process governed by stabilizing selection. However, with the recent Reich lab paper raising the possibility of directional selection on IQ, I was curious how the results would change under directional selection. My guess is that the selection coefficients would be greater, and thereby imply greater rare variant heritability?